04/15/2021
By Nikhil Rajendran | Reading time 6 mins
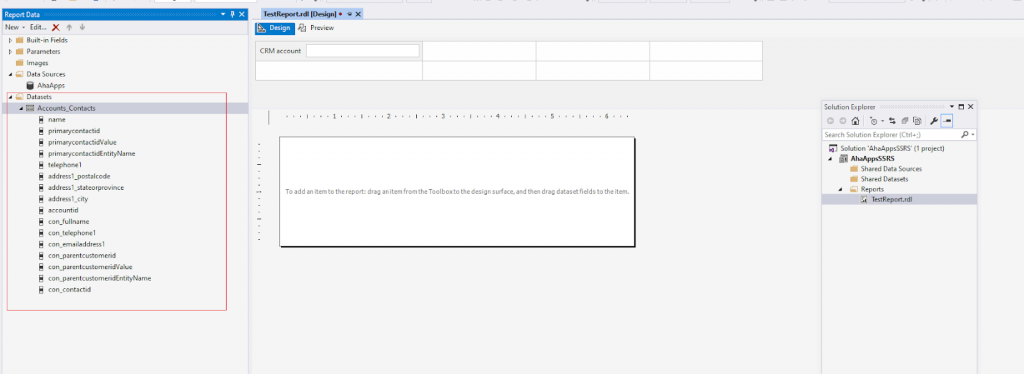
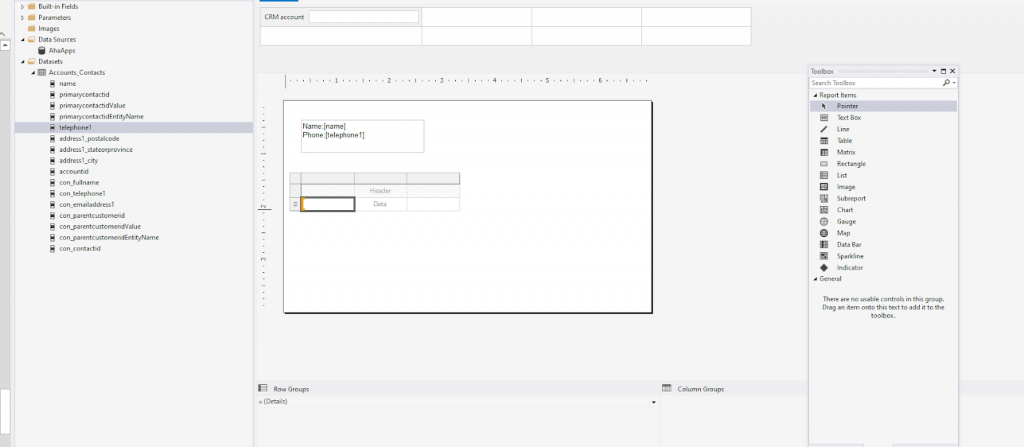
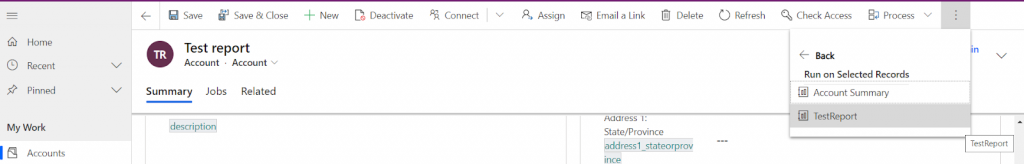
In the first part, we spoke about how to add the data source. Now, after adding that, we now have to add the dataset. The dataset is what we are going to be creating the report on. Let us take an example of creating a report on an account and its corresponding contacts. Account has a 1:N relationship with Contacts. One Account has many contacts.
To do that, in the report data right-click on the folder “Datasets” and click “Add Dataset..”
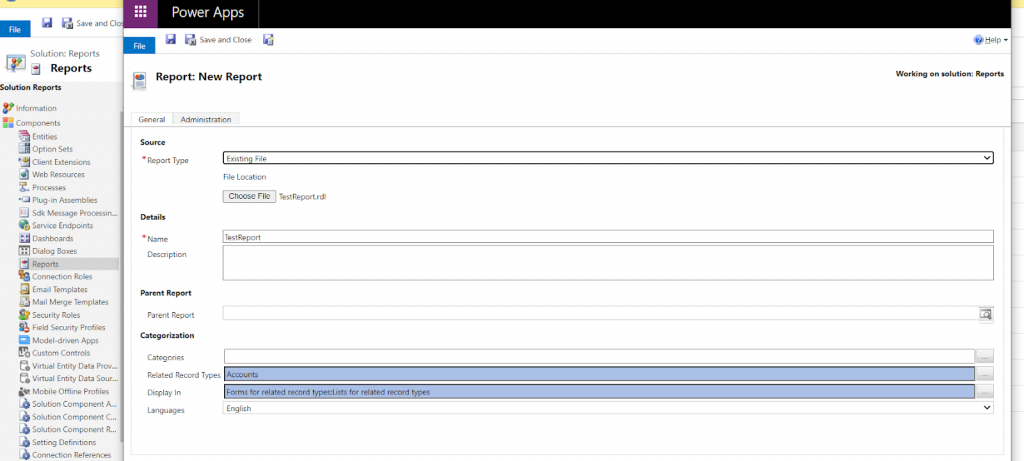
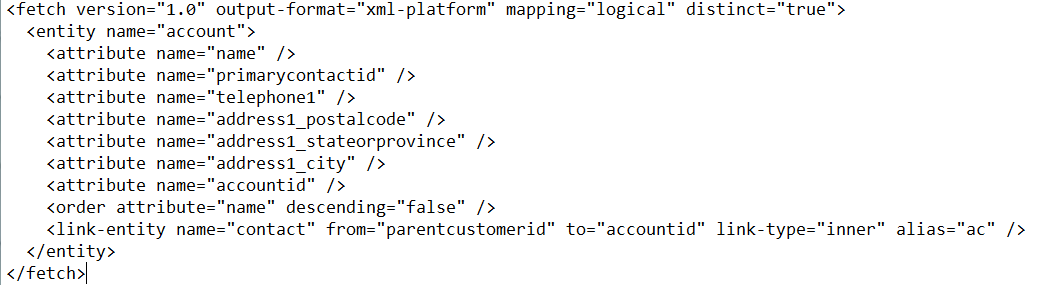
For the dataset, we need to have a Fetch XML query. To help with this, you can do an advanced find of what you need. For example, search for the accounts and corresponding contacts and click on Download Fetch XML.
Copy-paste the downloaded Fetch XML to the dataset window.
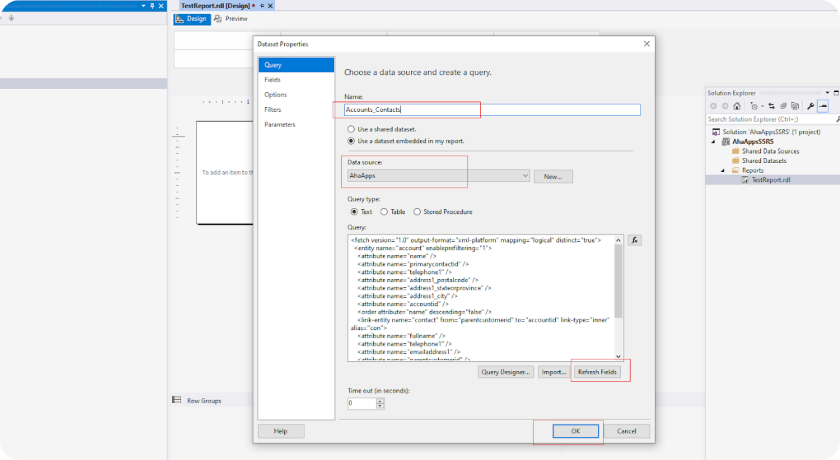
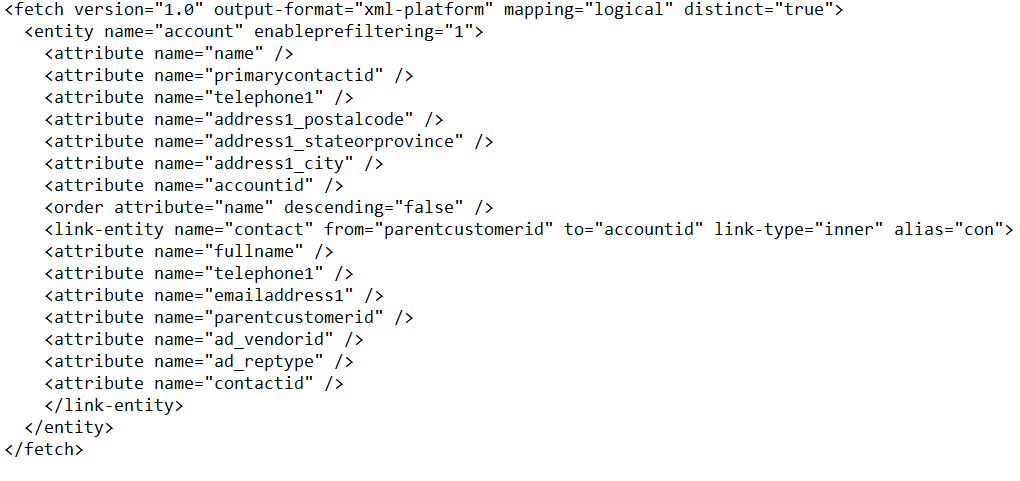
Now you can go ahead and paste this data source.
Now, all the fields you added appear on the left under the data set.
Now we can start adding our components to the report. First, ensure that the toolbox is visible. If it’s not, press Ctrl Shift X at the same time. The toolbox looks like this:
To add the components to the report, just drag and drop the component. For example, let’s say you want to add a text box, just click on Text box and drag and drop it at the exact location you want on the report.
Now you can enter some text inside the textbox. Let’s say you want to add the account name inside the textbox. It should look something like “Name:<insert account name here>”.The account name is going to be dynamic varying from report to report.
So just enter the text “Name:”.
After doing that, drag and drop “name” from under the data set right next to the “:” after “Name” in the text box. Now the text box will look like the following:
You can add more components to the textbox. Increase the length, the width of the textbox according to your components.
I have also added the Phone number of the account.
Next, let’s say we want to add data from the related contacts. In general, the data from the link entity is put on a table. So drag and drop the table component.
In general, the first row of the table is the “header” and the data is below that.
Similar to how we added the name for the account, we need to do it for the contact fields. Just drag and drop the necessary fields. (Note: drag and drop the fields with the prefix of the alias. In my case it will be con_fullname, con_emailaddress1..)
So after dragging and dropping, my table will look similar to this:
Now just change the header names to what it truly represents. After changing my headers, my table looks like this:
Now the report is ready. To run this report in my example, I have to open a particular account record, click on the “Run report” button, and click on the report name.
Nikhil has been with AhaApps since 2017 as a Microsoft Dynamics CRM Developer. He is a driven CRM expert who is ready to fight off the challenges in the Dynamics world with his technical know-how and prowess. He is a sports enthusiast and loves to play tennis when he gets time. He is also a voracious reader and enjoys reading philosophical books.
When the client wants changeable documents to be attached in the D365 ecosystem, what do you do?