05/14/2020
By Nikhil Rajendran | Reading time 5 mins
By Nikhil Rajendran | Reading time 5 mins
As a developer, there are times when you need to debug a plugin. In order to do that, typically you would have written some trace statements or you were planning to get the error logs and step through the code in Visual Studio.
One thing is common – both the types of debugging need the error logs to be downloaded. There could be a few instances where you might not have gotten the error logs. So let’s take a look at a couple of settings which need to be taken care of.

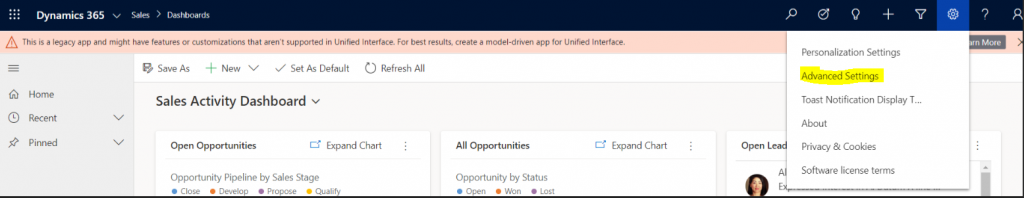
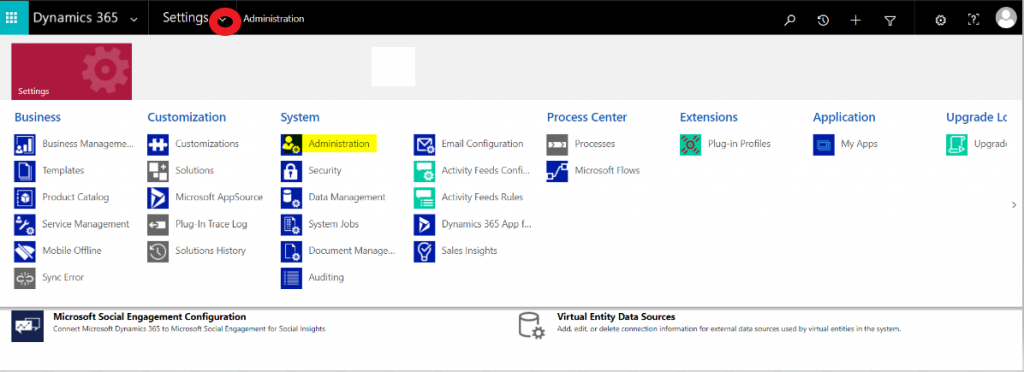
Go to Settings/Administration/System Settings.
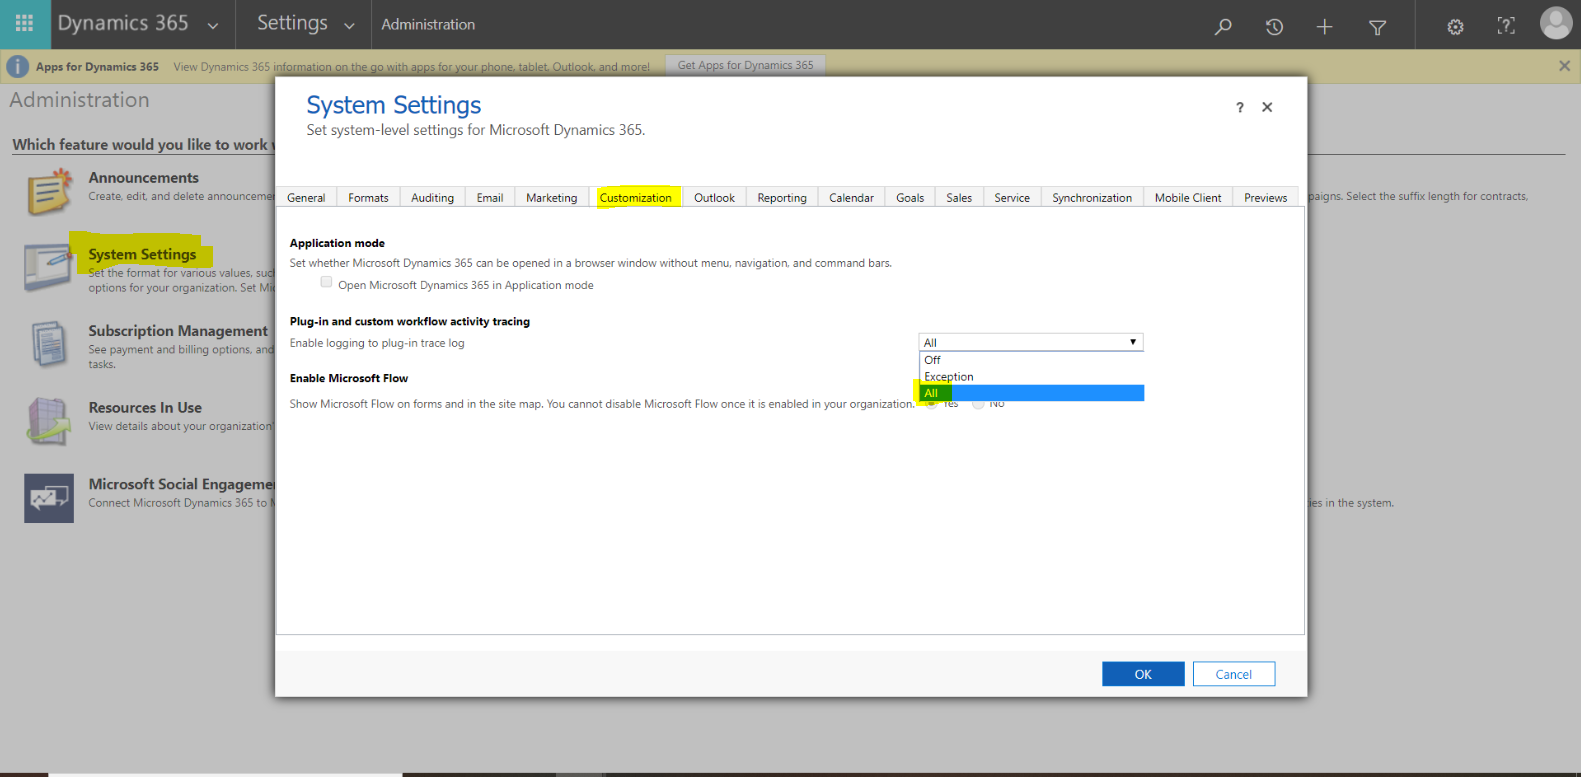
Click on the Customization tab. Under plugin and custom workflow activity tracing, ensure the setting for “Enable logging to plug-in trace log is set to “All”. Once you selected that option, Click Ok.
A lot of the developers forget about the above settings change because, by default, the logging is set to off. We need to manually change it to “All” to enable the logging.
It is recommended to disable the capturing of logs in Prod (turn the above setting to off) because it can prevent the unnecessary capture of error logs. If there is an issue, we can always replicate it in DEV/QA environments and capture the logs there.
If you want to know more about Dynamics CRM and the way it can revolutionize your operations, connect with us today.
Nikhil has been with AhaApps since 2017 as a Microsoft Dynamics CRM Developer. He is a driven CRM expert who is ready to fight off the challenges in the Dynamics world with his technical know-how and prowess. He is a sports enthusiast and loves to play tennis when he gets time. He is also a voracious reader and enjoys reading philosophical books.
Learn how to tweak the session timeout settings from Sunil, our Dynamics CRM guru in the next blog.